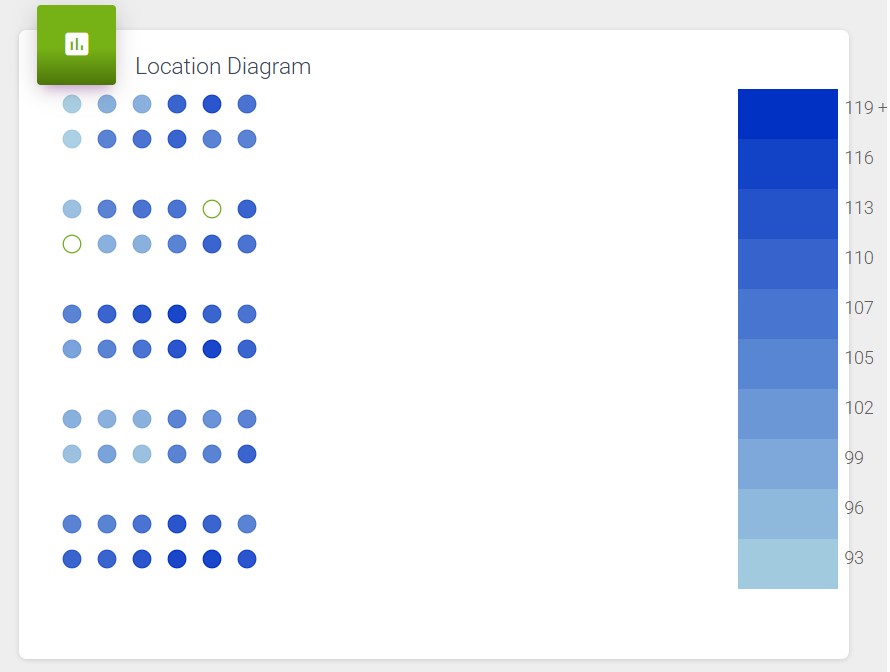
Spatial variations in temperature and relative humidity within a greenhouse can be significant, often exceeding 10°C and dozens of percentage points in relative humidity. Assuming these parameters are uniform throughout the entire facility can easily lead to misleading conclusions.
To address this challenge, we offer the Atmos-14 atmospheric sensor. It connects to any controller throughout your greenhouse to provide precise, localized atmospheric data.
To help you identify the areas in your growing facility that experience the most extreme conditions relative to the average, ensuring you place your sensors in the most strategic spots, we recommend the following simple method:
Setup an experiment configuration, but place only the green reservoirs on the scales, without any pots, soil, or plants.
Remove the black drainge silicon plug (photo 1) and seal the reservoirs with a small rubber cap (photo 2).
Fill all the reservoirs with the same amount of water. You can use the rim of the reservoirs as a unifying level (photo 3).
Add 1 mL of household blech 5% NaOCl to each reservoir to prevent bacteria and algee growth.
Let these reservoirs sit undisturbed for 2-7 days.
Use SPAC analytics Graph Viewer with Weight parameter to indentify resiovars that leaked in order to exlude them for any further analysis (photo 4).
Use SPAC analytics Graph Viewer with Traspiration Rate parameter to indentify resiovars with unusual transpiration behavior (photo 5).
In SPAC under Analysis --> Histogram chose 'Daily Transpiration' as the parameter and under 'Plants' exlude resiovars that leaked or had unusual transpiration behavior (photo 6).
Use the heat map generated to understand and learn about the microclimate at your greenhouse (photo 7).
With the information you gathered you may:
- Change the position of your ATMOS sensors.
- Associate Plantarray positions with weather stations based on microclimate similarity rather than geographic proximity.
This map will pinpoint the microclimates and extreme positions within your growing facility, allowing you to deploy your Atmos-14 sensors in a much more effective and data-driven way.
Photo 1:
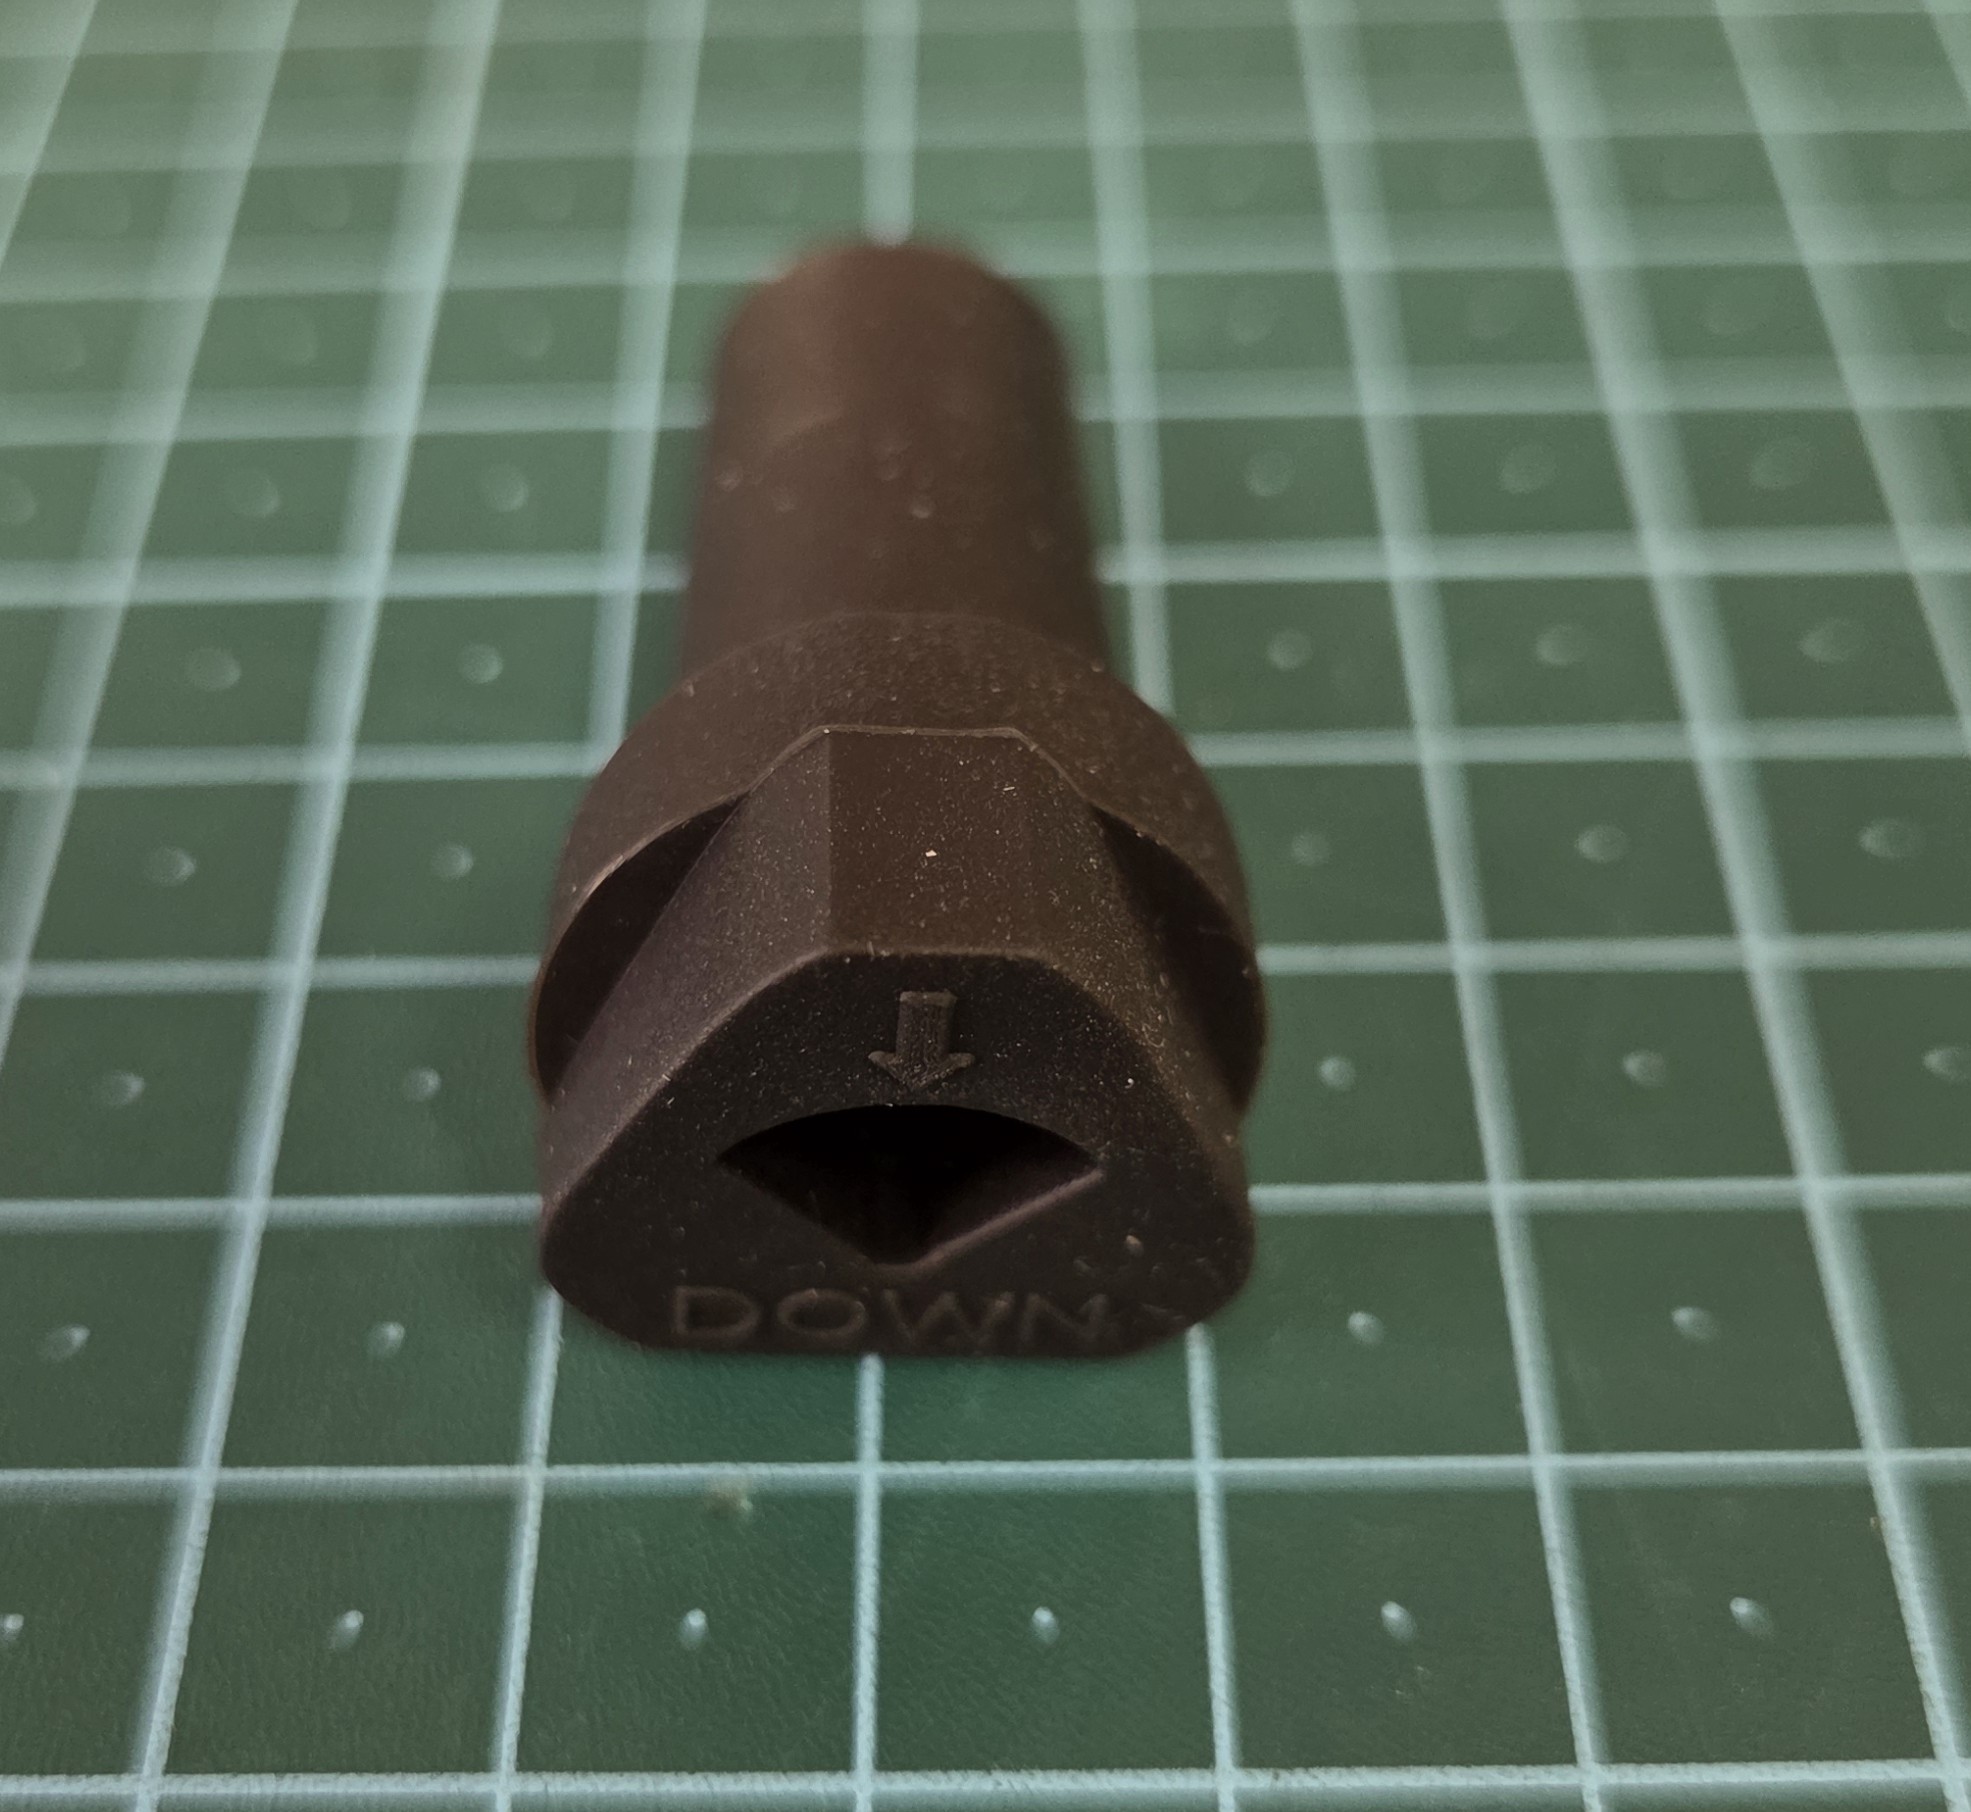
Photo 2:
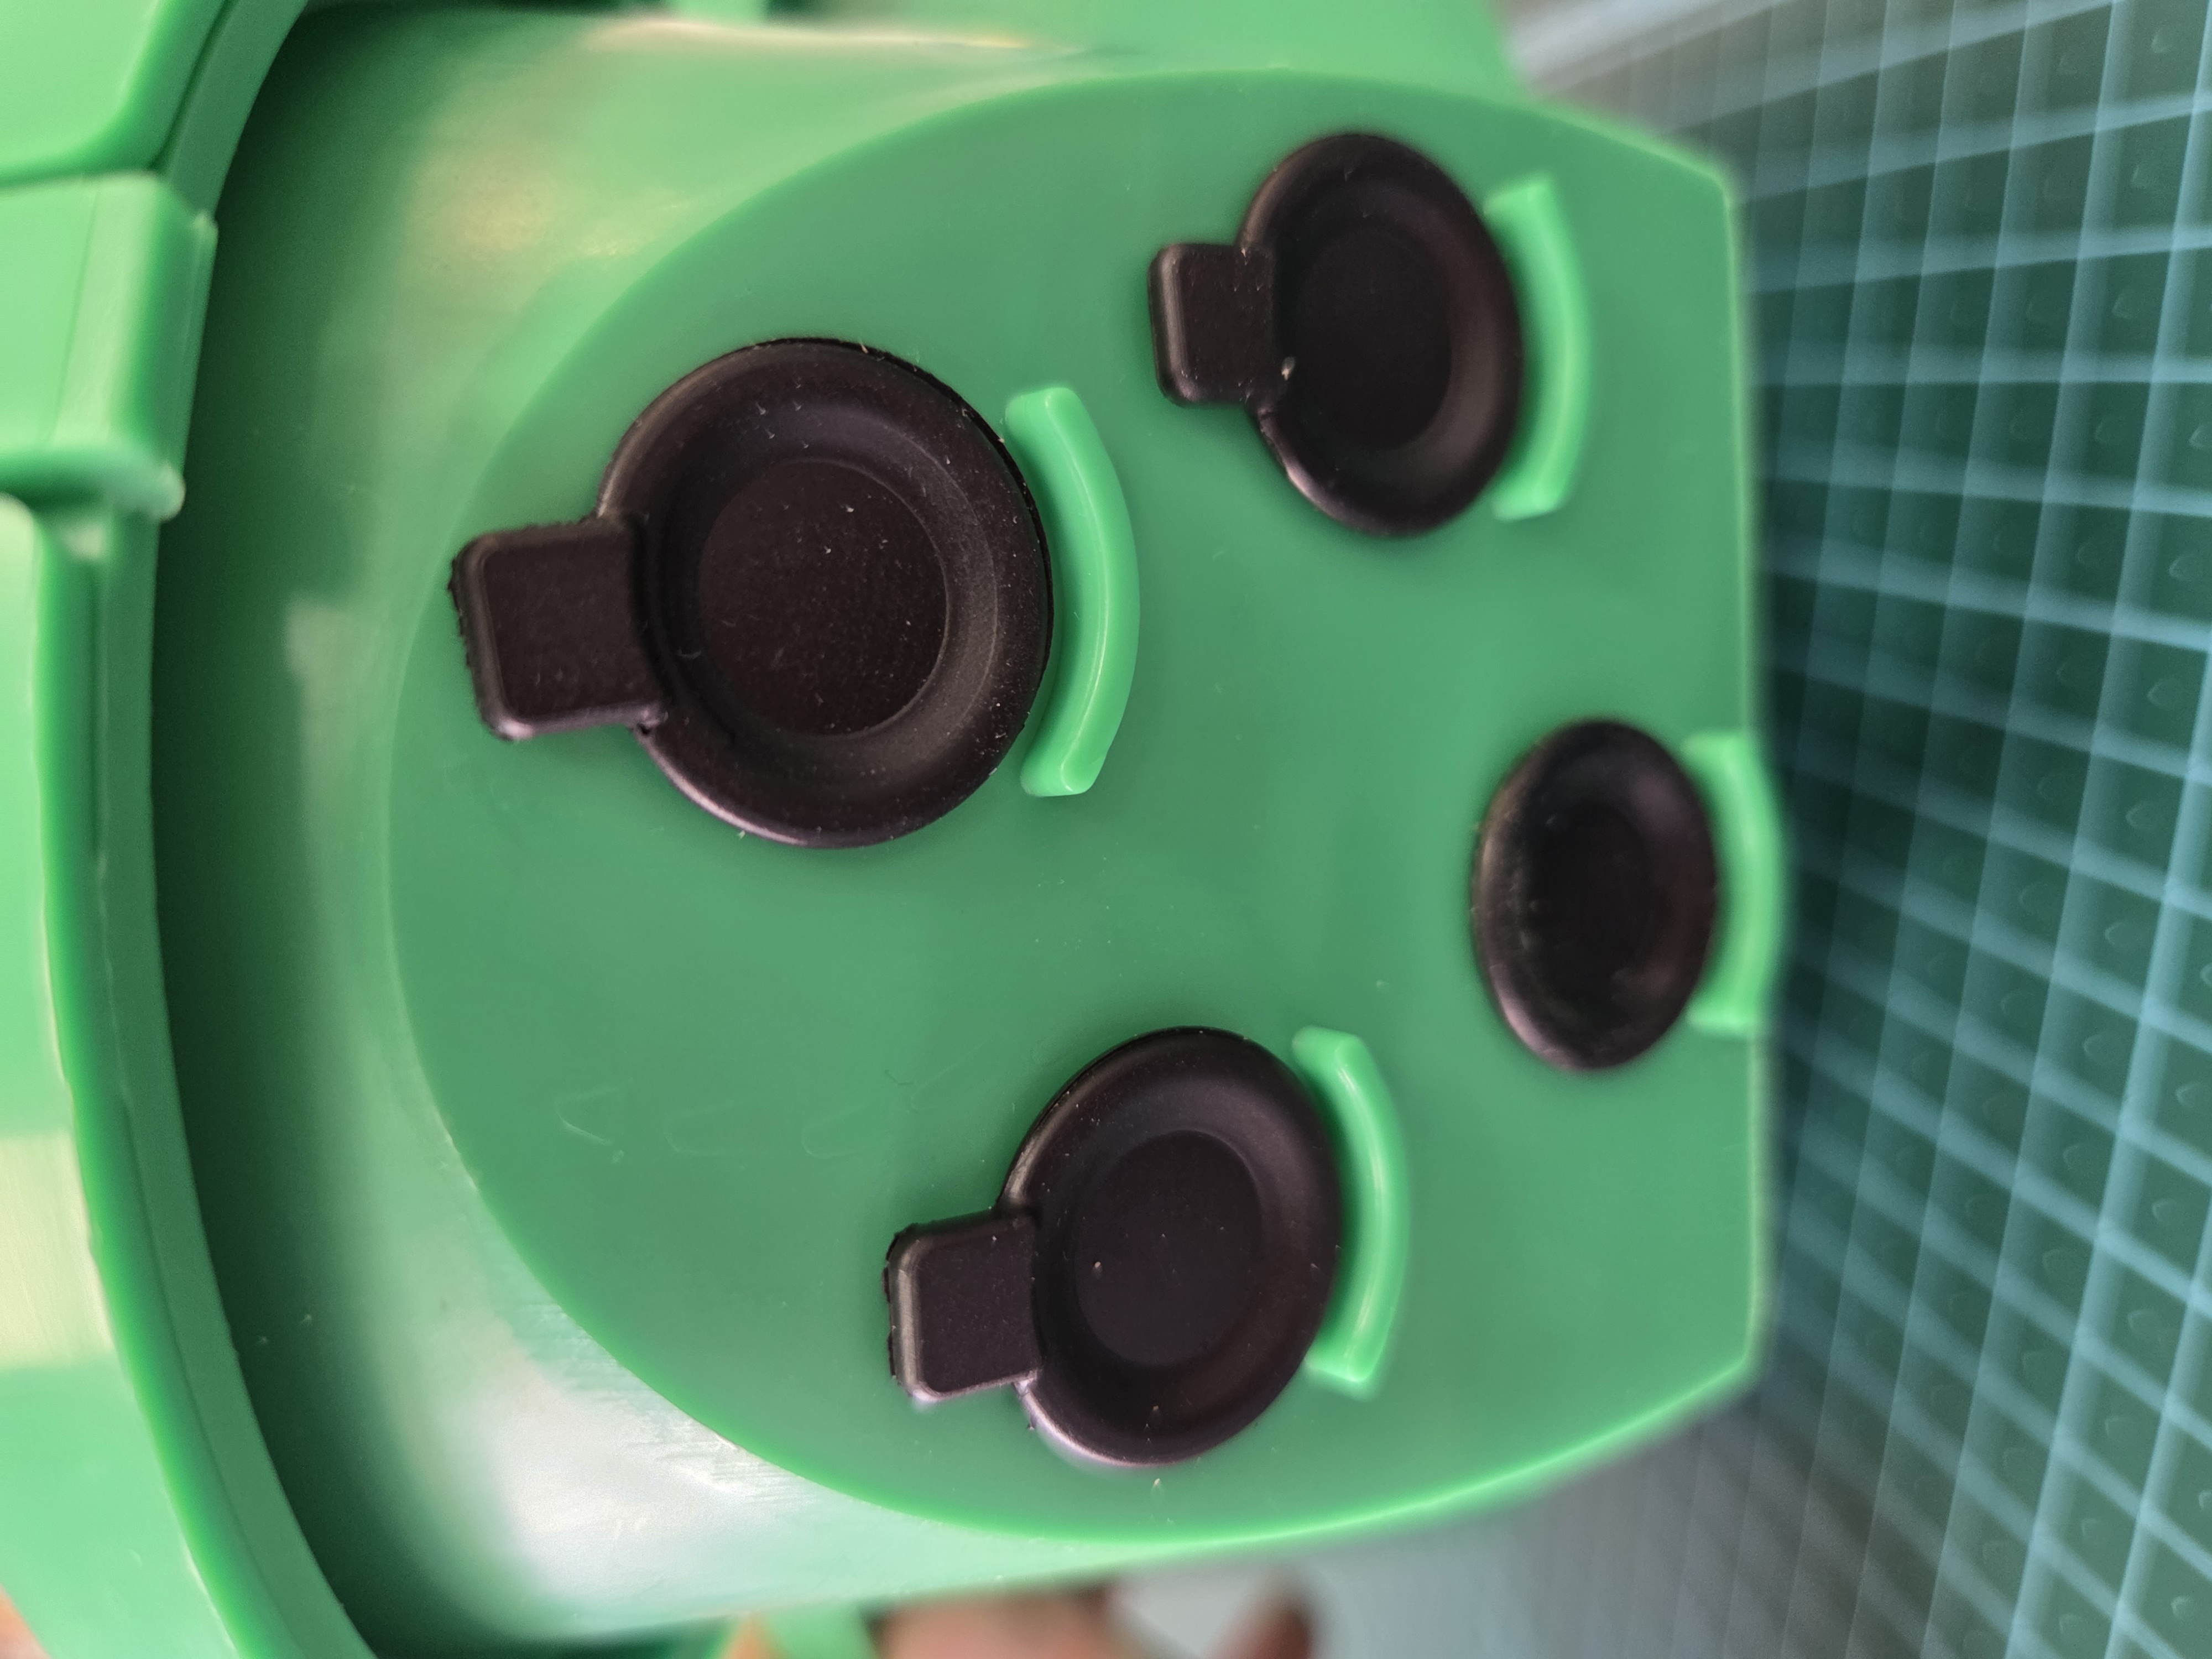
Photo 3:
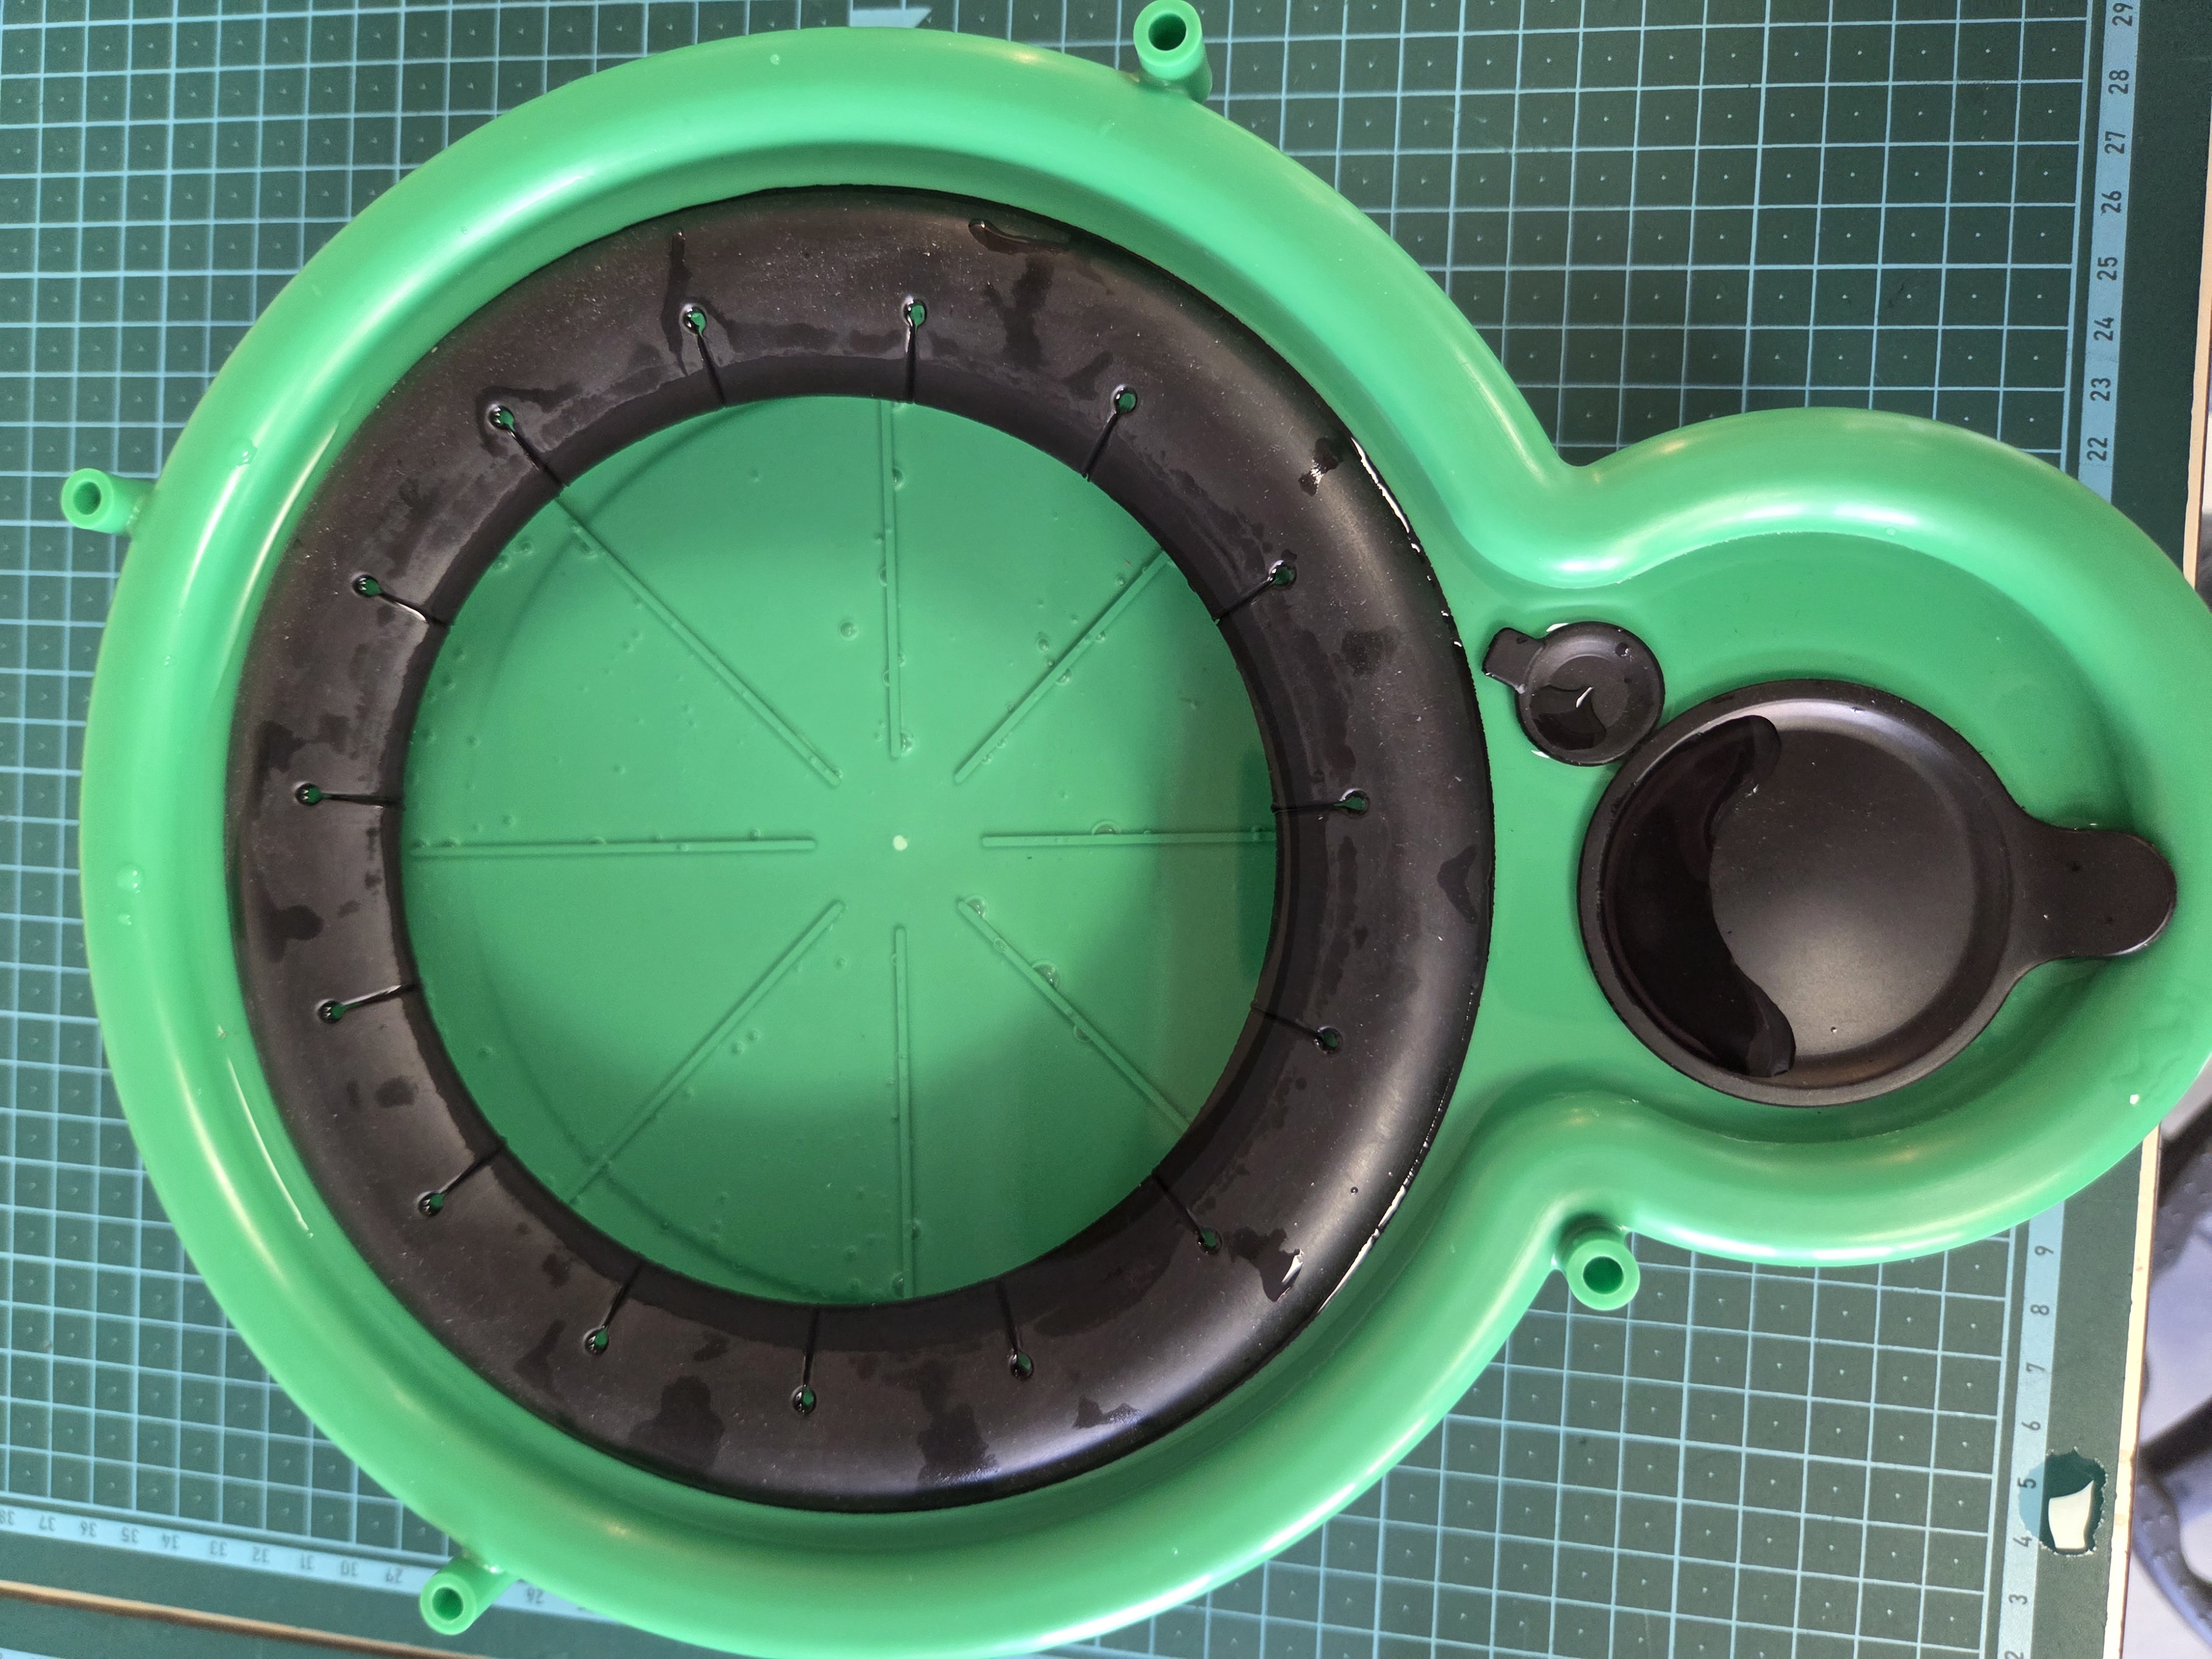
Photo 4:
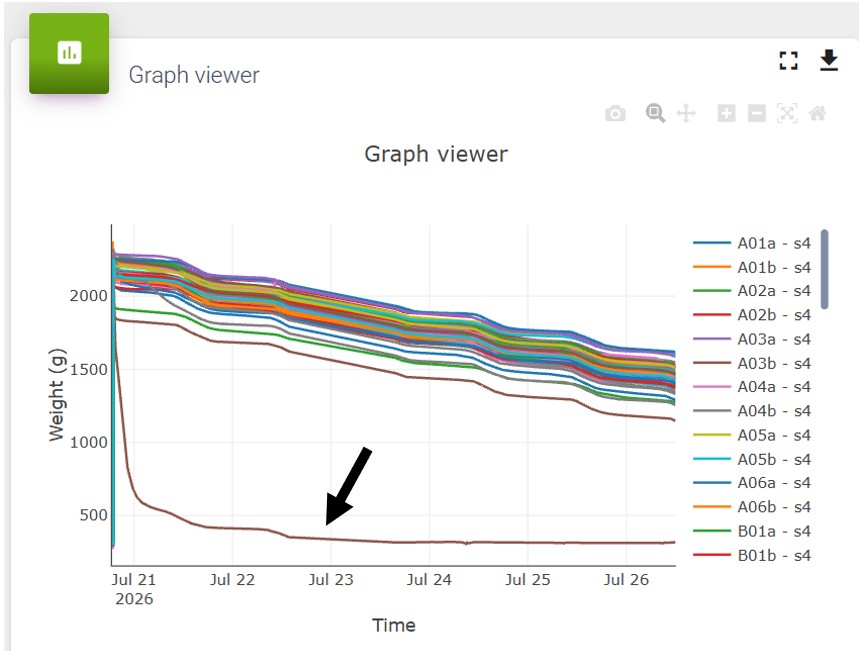
Photo 5:
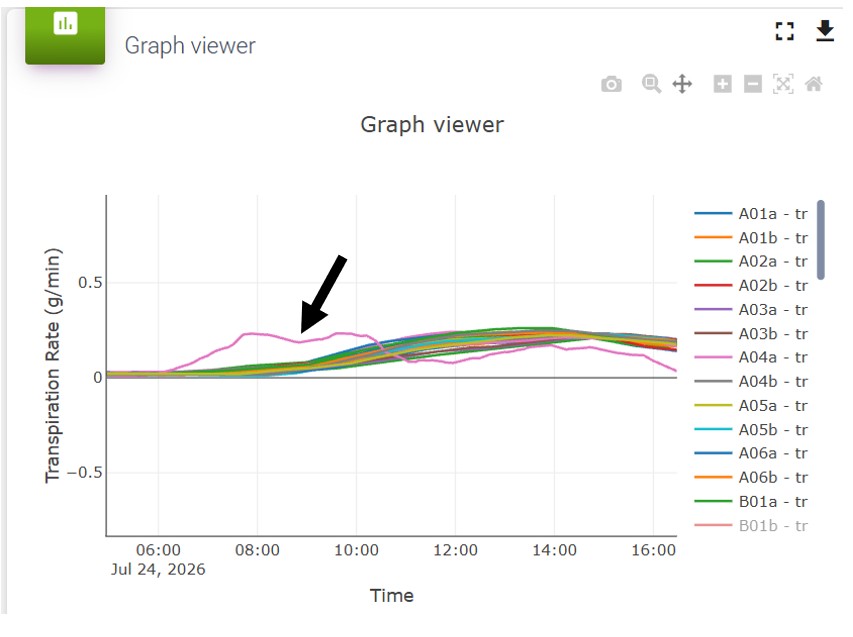
Photo 6:
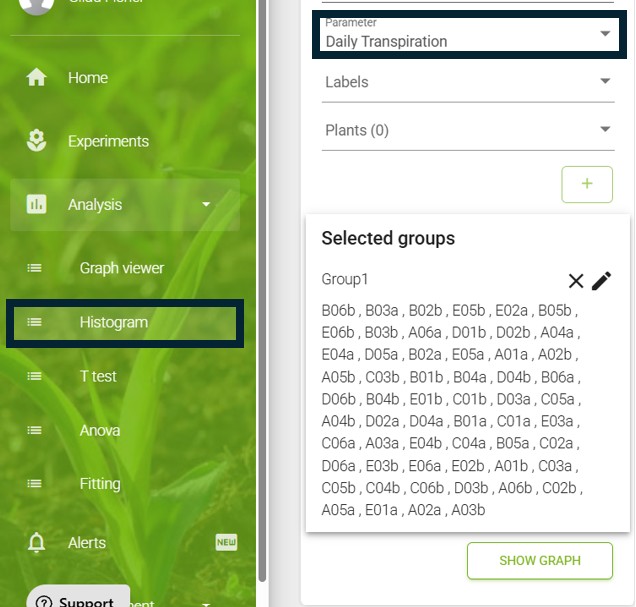
Photo 7: